Investing in Banks? Find Comfort in Excess Capital.
Our Special Global Equity team explains why they believe U.S. G-SIBs, with more than $150 billion in excess capital, are currently undervalued and regional banks are overvalued relative to their respective risk profiles.

Key takeaways
- U.S. commercial real estate (CRE) continues to face challenges, and regional banks—the largest CRE lenders—are the most vulnerable financial institutions affected.
- Large-cap banks hold half the level of CRE loans as a percentage of their loan books versus the industry.
- In addition to low CRE exposure, the eight large U.S. banks that are global systemically important banks (G-SIBs) have a combined capital cushion of more than $150 billion.
- Therefore, we see a case for investing in overcapitalized G-SIBs in large-cap portfolios and holding underweights to smaller banks in small- and mid-cap portfolios.
Commercial real estate (CRE) is back in the spotlight following New York Community Bancorp’s fourth quarter 2023 report revealing loan losses and its two dividend-cut announcements this year. The current U.S. CRE challenges aren’t affecting just U.S. banks—lenders in Japan, Germany, and Canada have also reported sizable credit write-downs related to U.S. CRE. Morgan Stanley estimates that $1.2 trillion in CRE debt will mature through the end of 2025 and will need refinancing—roughly half of which is sitting on bank balance sheets.
The largest CRE lenders—regional banks—are likely the most vulnerable financial institutions facing this maturity wall as many CRE borrowers will be unable or unwilling to invest more equity into these assets and/or the CRE cash flows can’t support higher interest expense. In contrast, large-cap banks hold half the level of CRE loans as a percentage of their total loan books versus the industry (12% versus 24%), and the eight U.S. global systemically important banks (G-SIBs)1 hold even less.
In recent years, the U.S. Federal Reserve has raised capital requirements on U.S. G-SIBs to moderate the impact of any lending crises banks may face. The G-SIBs are required to hold excess capital in the form of a capital surcharge. The required capital cushion ranges from 100–450 basis points (bps; 100 bps equal 1.00%) more than what’s required for non-G-SIBs, and combined, U.S. G-SIBs hold more than $150 billion in excess capital. This capital is balance sheet capacity that can be used to acquire distressed assets should potential crises emerge.
Based on our balance-sheet-driven equity analysis, we believe G-SIBs are currently undervalued and regional banks are overvalued relative to their respective risk profiles. The reasons for our perspective include:
- The G-SIB capital buffer described earlier
- Changes to the loan loss accounting (CECL) rule that require a larger bad debt’s expense upon loan issuance
- Over a decade of G-SIB balance sheet de-risking
- More durable cash flow streams observed at the larger banks
Critical to this analysis is our conclusion that most small to midsize banks lack a durable competitive advantage. Thus, their clients largely exist based on faith that the bank will do no harm. Once that faith is broken, moving assets from one bank to another can be as simple as a few clicks on a computer. As we saw in early 2023, a lot of those clicks moved money into the largest banks in the country.
Whether it’s the held-to-maturity risk that emerged in 2023 or today’s CRE woes driving further bank equity erosion, the G-SIBs have the balance sheet capacity to take advantage of opportunities as regional banks are forced to act defensively by raising capital; selling non-core assets; or, in the worst case, failing—as seen with Signature Bank, Silicon Valley Bank, and First Republic Bank. As an example from 2023, First Republic's failure was an opportunity for G-SIB JPMorgan Chase & Co., which was able to acquire the regional bank at a discount to First Republic's book value, further bolstering JPMorgan's earnings power. Therefore, we currently see a case for investing in the most overcapitalized G-SIBs in large-cap portfolios and maintaining underweights to the competitively disadvantaged and financially inferior banks in small- and mid-cap portfolios.
This chart shows the market beginning to appreciate the difference between large and small banks by comparing the total returns of the G-SIBs versus regional banks.
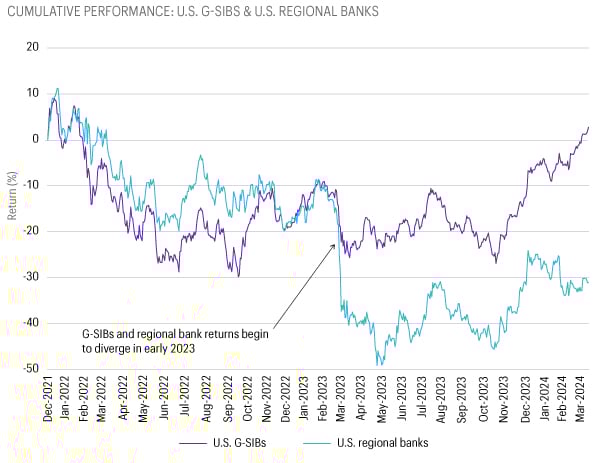
Sources: Allspring and Bloomberg Finance L.P., 31-Dec-21 through 13-Mar-24
U.S. regional banks are represented by the SPDR® S&P® Regional Banking ETF (ticker: KRE), which seeks to provide results that, before fees and expenses, correspond generally to the total return performance of the S&P® Regional Banks Select Industry Index.
U.S. G-SIBs shows the performance of a capitalization-weighted (as of 01-Jan-22) group composed of the stocks of the eight U.S. G-SIBs: Bank of America Corp. (BAC); The Bank of New York Mellon Corp. (BK); Citigroup Inc. (C); The Goldman Sachs Group, Inc. (GS); JPMorgan Chase & Co. (JPM); Morgan Stanley (MS); State Street Corp. (STT); and Wells Fargo & Company (WFC).
1. A G-SIB is a bank whose failure could threaten the international financial system. The eight U.S. G-SIBs are Bank of America Corp.; The Bank of New York Mellon Corp.; Citigroup Inc.; The Goldman Sachs Group, Inc.; JPMorgan Chase & Co.; Morgan Stanley; State Street Corp.; and Wells Fargo & Company.
The S&P Regional Banks Select Industry Index represents the regional banks segment of the S&P Total Market Index (TMI). (The S&P TMI is designed to track the broad U.S. equity market.) You cannot invest directly in an index.
Related insights

Hyperscalers are investing in artificial intelligence (AI) and infrastructure to drive innovation while navigating challenges—balancing short-term demands with long-term growth opportunities.

Insight
PM Spotlight: Wired for GrowthMike Smith is a senior portfolio manager and head of Allspring’s Growth Equity team. His team’s diversified approach focuses on stocks with robust, sustainable, and underappreciated growth across the market-cap spectrum.

Bryant VanCronkhite is a senior portfolio manager and co-head of Allspring’s Special Global Equity team. The team looks for market inefficiencies using a CPA’s knowledge and approach to analyzing financial statements.

Read the latest update from the Rising Dividend Equity team to discover what sets dividend growers apart and how they may offer a compelling allocation opportunity for investors.

Allspring equity portfolio managers Bryant VanCronkhite, Alison Shimada, and Mike Smith sit down to explore current market conditions, economic uncertainties, and potential investment strategies for 2025. They break down the unique challenges and opportunities in current equity markets and the importance of active management and resilience during times of volatility.

Investors face uncertainty around U.S. presidential elections, driving market volatility. How might companies be affected? Have elections affected equity returns long term? Allspring’s Ann Miletti provides perspective.

We discuss two risks investors face: 1) the increased risk in strategies mirroring the S&P 500 as just a few holdings drive its results, and 2) the huge wall of corporate debt maturing in 2025–2029 that will need renewal at much higher rates.

The Special Global Equity team identifies three current market conditions, including U.S. large cap concentration, high but falling inflation, and attractive small-cap stock valuations, and explores why they may signal a comeback for global small-cap stocks.
This material is provided for informational purposes only and is for professional/institutional and qualified clients/investors only. Not for retail use outside the U.S. Recipients who do not wish to be treated as professional/institutional or qualified clients/investors should notify their Allspring contact immediately.
THIS CONTENT AND THE INFORMATION WITHIN DO NOT CONSTITUTE AN OFFER OR SOLICITATION IN ANY JURISDICTION WHERE OR TO ANY PERSON TO WHOM IT WOULD BE UNAUTHORIZED OR UNLAWFUL TO DO SO AND SHOULD NOT BE CONSIDERED INVESTMENT ADVICE, AN INVESTMENT RECOMMENDATION, OR INVESTMENT RESEARCH IN ANY JURISDICTION.
INVESTMENT RISKS: All investments contain risk. Your capital may be at risk. The value, price, or income of investments or financial instruments can fall as well as rise and is not guaranteed. You may not get back the amount originally invested. Past performance is not a guarantee or reliable indicator of future results.
Unless otherwise stated, Allspring is the source of all data (which is current or as of the date stated). Content is provided for informational purposes only. Views, opinions, assumptions, or estimates are not necessarily those of Allspring or their affiliates and there is no representation regarding their adequacy, accuracy, or completeness. They should not be relied upon and may be subject to change without notice.