The Great Risk Reversal: Why Emerging Markets in 2026
Emerging markets (EM) have undergone a structural shift, with stronger external balances, rising credit quality, and broadening earnings growth reshaping their risk profile and investment appeal in 2026.

Key takeaways
- Structural risk has declined as EM external balances, reserves, and sovereign credit profiles have materially improved.
- Earnings growth is accelerating, with broader sector participation and potentially expanding return on equity in supporting valuations.
- Policy dispersion may be creating targeted opportunities in markets like Brazil, South Africa, and selective segments of China.
- Money flows into EM are poised to rise, with the asset class still under-owned relative to long-term averages.
For much of the past decade, emerging markets (EM) were viewed primarily as a high-beta extension of global growth. Allocators tended to treat the asset class as cyclical exposure, sensitive to dollar strength, commodity swings, and Federal Reserve policy shifts. That framing made sense in the aftermath of the 2013 “taper tantrum,” when several large EM economies were running wide current account deficits and relying heavily on external funding.
Today, the environment looks materially different as external balances have improved across much of the developing world and sovereign credit quality has strengthened. Meanwhile, developed markets are confronting rising fiscal pressures and greater policy uncertainty. As a result, the traditional risk hierarchy between EM and developed markets looks less clear-cut than it once did.
Beyond the Fragile Five
To understand how meaningful this change is, it helps to look back at 2013. During the taper tantrum, countries such as India, Brazil, South Africa, Turkey, and Indonesia were labeled the “Fragile Five.” Current account deficits in several cases exceeded 4% of gross domestic product (GDP). Across the group, capital outflows exposed deep vulnerabilities, currencies depreciated sharply, and funding costs spiked. The lesson for global investors was straightforward: EM were structurally dependent on foreign capital and vulnerable to shifts in U.S. monetary policy.
Over the past decade, that picture has steadily improved. Many emerging economies have narrowed or eliminated their current account deficits. External financing needs are generally lower, foreign exchange reserves are stronger, and domestic capital markets have deepened. This repair has been gradual, but the cumulative effect is significant. EM today are less reliant on short-term external funding and are better positioned to manage periods of global stress than they were in 2013.
In contrast, the United States has seen its current account deficit widen, and its fiscal deficits remain elevated. While we do not view this as an imminent crisis, it does suggest that the traditional assumption of developed market exceptionalism deserves scrutiny. When balance sheet trajectories are compared, rather than simply income levels, the contrast between emerging and developed markets is not as stark as it once was.
Credit markets signal improvement
Fixed income markets often recognize structural improvement before equity markets do. In aggregate, EM sovereign credit ratings are now at their highest levels in roughly 35 years.1 This indicates that the systemic vulnerabilities of the past are less acute.
Credit upgrades over the past decade have reflected stronger policy frameworks and better fiscal discipline in several large markets. Inflation targeting regimes have matured, local currency bond markets have developed, and governments have generally become more cautious about external leverage. Sustainability metrics have also trended steadily higher for the MSCI EM Index, reinforcing the broader improvement in governance standards and institutional frameworks across the asset class.
By comparison, debt-to-GDP ratios in several developed markets have continued to climb. Trade policy has become less predictable, and questions about the future path of the U.S. dollar are also more visible than they were 5 or 10 years ago.
Taken together, these developments imply that the relative risk premium historically embedded in EM assets is compressing and that the structural case for viewing them as inherently fragile is weaker than it once was.
Earnings acceleration and ROE expansion
Structural improvement is necessary, but not sufficient, for strong EM equity performance. Ultimately, earnings growth and returns on capital drive long-term results.
Here, too, the outlook is encouraging. Consensus estimates point to EM earnings growth accelerating from 15.7% in 2025 to 23.8% in 2026.2 Importantly, that growth is not confined to a narrow group of technology companies linked to global artificial intelligence spending. Signs of broader participation across sectors are becoming more apparent.
EM earnings momentum shows relative strength
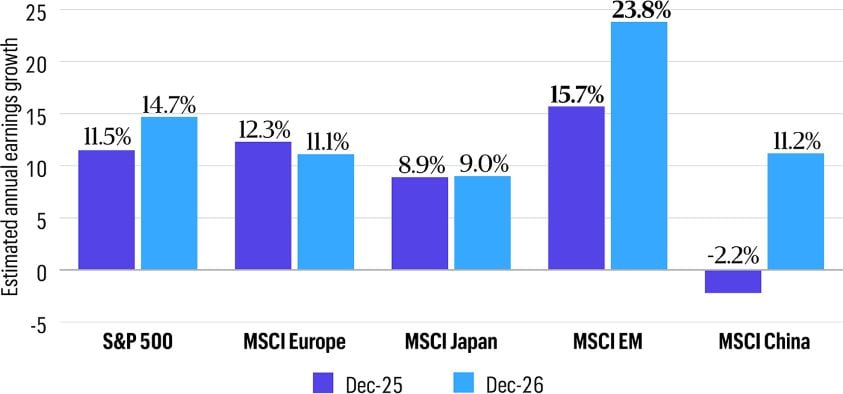
Source: FactSet, as of 28-Jan-26. Estimated data is not a promise or guarantee of future results.
Consumer staples and discretionary businesses in several markets are benefiting from easing monetary policy and improving real incomes. Industrial and commodity producers are supported by stabilizing demand and, in some cases, disciplined supply conditions. Financials in rate-sensitive economies stand to gain as policy cycles turn.
Return on equity (ROE) trends across EM have also strengthened in recent years. As interest rates decline in a number of countries, the spread between ROE and cost of equity has the potential to widen. That dynamic supports higher valuation multiples, particularly for companies with durable franchises and strong balance sheets.
Capital allocation discipline has improved as well. Share buybacks and dividends have accelerated, particularly in Asia, as companies increasingly focus on shareholder returns rather than empire building. These are incremental shifts, but they add up over time.
For equity investors, the key takeaway is that the macroeconomic repair story is now intersecting with a more constructive earnings cycle. That combination provides a stronger foundation than we have seen in several prior EM upswings, which were often driven more by liquidity than by fundamentals.
Opportunity in policy dispersion
We believe 2026 is less about broad beta exposure to EM and more about policy dispersion. Most EM countries are facing a benign inflation and interest rate environment, and countries entering easing cycles from relatively high real-rate starting points look poised to benefit the most.
Brazil is a prime example. The economy remains highly sensitive to interest rates, in part because of the structure of its credit markets where lower rates feed relatively quickly into consumer credit, housing, and financial sector activity. As inflation has moderated, the central bank has begun easing policy and is expected to continue. Historically, Brazilian equities have responded positively around and following the first rate cuts of a cycle. Of course, this does not guarantee a smooth path. Political noise and fiscal debates persist. From a bottom-up perspective, however, the direction of policy is an important tailwind for earnings in several domestic sectors.
South Africa offers a different type of opportunity. For years, rolling power outages constrained growth and weighed on investor sentiment. More recently, energy availability has improved meaningfully, supported in part by private investment and increased renewable capacity. While challenges remain, the easing of the most acute power bottlenecks changes the earnings trajectory for certain industrial, consumer, and logistics businesses.
The South African Reserve Bank is also expected to resume its easing cycle, which could support domestic demand. Valuations in several sectors remain relatively low, both on an absolute basis and compared with global peers. This creates a setup where incremental improvements in operating conditions can translate into meaningful equity returns.
China requires a more selective approach. With interest rates already low and deflation risks persisting, there is less room to stimulate the economy through monetary policy. Following a period of broad, beta-driven performance, greater dispersion is emerging. Policy priorities under the forthcoming Five-Year Plan suggest continued support for advanced manufacturing, selected technology segments, and domestic consumption. Geopolitical tensions and trade frictions remain part of the backdrop. Rather than treating China as a single trade, investors need to differentiate carefully between areas aligned with structural policy support and those facing headwinds.
More than a mega-cap story
Another underappreciated aspect of the current setup is the breadth of the opportunity set. In recent years, the performance of EM indexes has been driven by a handful of large technology companies. While those businesses remain central, the rally is beginning to broaden beyond mega-cap names.
Counterintuitively, small-cap equities in EM have historically outperformed their large-cap counterparts over long rolling periods.3 They also tend to have significantly lower analyst coverage and greater dispersion of outcomes. That combination creates fertile ground for active managers.
Structural shifts in global supply chains are also directing incremental foreign direct investment toward Southeast Asia and parts of the Middle East, which now account for more than 50% of China’s Belt and Road Initiative engagements. China’s outbound investment patterns have evolved from large, state-led infrastructure projects toward smaller, commercially oriented initiatives, often led by private enterprises. These investments embed productive capacity in host economies and can support multi-year growth trajectories.
The opportunity set is therefore expanding beyond the largest index constituents. Domestic champions, early-stage growth companies, and businesses tied to local reform agendas are best positioned to offer differentiated sources of return.
A more durable setup
What looks different in 2026 is the combination of repaired external balances, improved sovereign credit quality, broadening earnings growth, and policy cycles that are turning supportive in several key markets. Developed markets, by contrast, are facing their own set of fiscal and policy uncertainties. In our view, that mix creates a more compelling backdrop than we have seen in some time. Although trade tensions remain part of the backdrop, direct revenue exposure to the United States across the MSCI EM Index is a mere 7.6%,4 suggesting that the aggregate earnings impact of renewed tariff escalation would likely be manageable.
The traditional view of EM as a purely speculative growth trade no longer captures the full picture. Instead, we see an asset class where structural risk has declined, earnings momentum is broadening, and selective opportunities are emerging across countries and market capitalizations.
As capital flows have turned positive, EM are transitioning from what might be called “potential energy” to something more kinetic. For several years, the structural conditions for stronger performance were quietly forming. In 2026, those conditions are increasingly translating into observable earnings growth, improving returns on capital, and more supportive policy backdrops.
Flows into EM should continue to accelerate
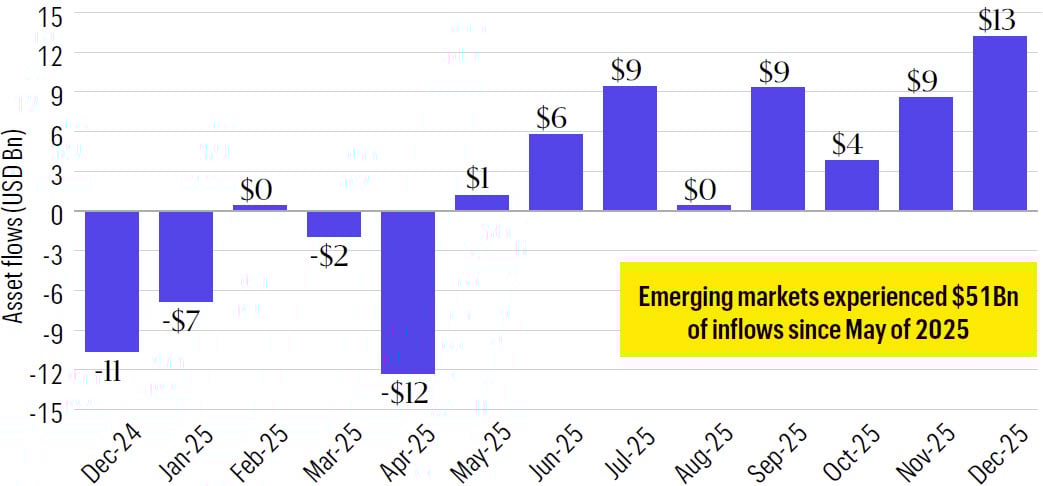
Sources: EPFR Global and JPMorgan, as of 31-Dec-25. For illustrative purposes only. Any reference to a security, issuer, or other financial instrument is shown for illustrative purposes and is not a recommendation to trade. Past performance is not a reliable indicator of future results.
Despite these improvements, EM remain underrepresented in global portfolios. EM equities currently account for roughly 5.3% of global equity assets under management, compared with a 10-year average closer to 6.7%.5 According to JPMorgan estimates, a reversion toward that historical weighting would imply more than $500 billion of incremental inflows over time.
For long-term investors, the risk of remaining structurally underweight EM may now be more consequential than the volatility traditionally associated with the asset class. Conditions that once represented latent potential are increasingly translating into tangible performance. We believe that process still has room to play out.
-
Sources: Allspring and BofA Global Research, estimates as of 31-Dec-25.
-
Source: FactSet, as of 28-Jan-26.
-
Source: FactSet. Data period covers all 5-year annualized excess returns of the MSCI EM Small Cap-Net Index over the MSCI EM-Net Index from Jan 2001 through Dec 2025.
-
Sources: Goldman Sachs Global Investment Research and FactSet, as of 30-Sep-25.
-
Sources: EPFR Global and MSCI, data as of September 2025.
Standard & Poor's 500 Index (S&P 500 Index)
The S&P 500 Index consists of 500 stocks chosen for market size, liquidity, and industry group representation. It is a market-value-weighted index with each stock's weight in the index proportionate to its market value.
MSCI Europe Index
The MSCI Europe Index is part of the Modern Index Strategy and represents the performance of large- and mid-cap equities across 15 developed countries in Europe.
MSCI Japan Index
The Morgan Stanley Capital International (MSCI) Japan Index is designed to measure the performance of the large- and mid-cap segments of the Japanese market. With 272 constituents, the index covers approximately 85% of the free-float-adjusted market capitalization in Japan.
MSCI China Index
The Morgan Stanley Capital International (MSCI) China Index is a free-float-adjusted market-capitalization-weighted index that is designed to measure equity market performance in China.
MSCI Emerging Markets Index (Net) (MSCI EM Index)
The Morgan Stanley Capital International (MSCI) Emerging Markets (EM) Index (Net) is a free-float-adjusted market-capitalization-weighted index that is designed to measure the equity market performance of emerging markets.
MSCI Emerging Markets Small‑Cap Index (Net) (MSCI EM Small-Cap Index)
The Morgan Stanley Capital International (MSCI) Emerging Markets (EM) Small-Cap Index (Net) is a free float–adjusted market capitalization index designed to measure the equity performance of small‑capitalization companies in emerging markets. It represents the small‑cap segment of the broader MSCI Emerging Markets universe and targets companies included in the Investable Market Index (IMI) but excluded from the Standard Index.
You cannot invest directly in an index.
MSCI makes no express or implied warranties or representations and shall have no liability whatsoever with respect to any MSCI data contained herein. The MSCI data may not be further redistributed or used as a basis for other indexes or any securities or financial products. This report is not approved, reviewed, or produced by MSCI.
CFA® and Chartered Financial Analyst® are trademarks owned by CFA Institute.
ALL-02252026-i8xmczm9
This material is provided for informational purposes only and is intended for retail public distribution in the United States. Use outside the United States is for professional/qualified investors only.
Related insights

As passive investing dominates market flows, John Campbell, head of Systematic Core Equity at Allspring Global Investments, examines the risks of peak passive concentration and the case for broader diversification.

Listen to John Campbell from our Systematic Core Equity team discuss how multiple perspectives reveal the full picture of risk.

John Campbell reviews 2025's market performance, highlights elevated factor risks, and emphasizes a multidimensional approach to risk management and diversification for 2026.

Bryant VanCronkhite highlights the evolving AI landscape, a shift in small-cap market dynamics, and the potential for a massive multi-industry upgrade cycle driving economic and market growth in 2026.
Alison Shimada and Derrick Irwin discuss why now presents a pivotal time for investors looking at the asset class. Discover the shifting global dynamics and themes shaping the future of emerging markets (EMs) from two different perspectives.

The global landscape is shifting, and structural tailwinds are lifting emerging market (EM) equities. Investors capitalizing on these trends could benefit from transformative growth opportunities for years to come.

Video
The Dividend DivideAllspring experts explore the evolving role of dividends, debating their value as a source of stability, a tool for discipline, and their impact on flexibility in today's market.

Hyperscalers are investing in artificial intelligence (AI) and infrastructure to drive innovation while navigating challenges—balancing short-term demands with long-term growth opportunities.

Read the latest update from the Rising Dividend Equity team to discover what sets dividend growers apart and how they may offer a compelling allocation opportunity for investors.
Allspring equity portfolio managers Bryant VanCronkhite, Alison Shimada, and Mike Smith sit down to explore current market conditions, economic uncertainties, and potential investment strategies for 2025. They break down the unique challenges and opportunities in current equity markets and the importance of active management and resilience during times of volatility.