Funnel Cakes, Carnival Rides, and Municipal Bonds
The market volatility following “Liberation Day” drove municipal yields to levels not seen since the Global Financial Crisis, presenting real opportunities for investors.

Key takeaways
- Nicholos Venditti, head of Municipal Fixed Income, explains the opportunities that recent roller-coaster-like market volatility has provided for municipal bond investors.
- In previous periods when U.S. municipal bonds experienced 3% or larger weekly price declines, they were met with a rapid increase in yields available to investors.
Funnel cakes. Also, nachos. And, to be honest, how do you pass up the soft-serve ice cream? As a 10-year-old, I lived for the Colorado State Fair and all the treats that filled the boardwalk. That summer, though, I had a different mission: Conquer The Ring of Fire. The upside-down roller-coaster that terrified and captivated me for as long as I could remember.
The outcome? Less triumphant. Most of the carnival food made a dramatic and unfortunate exit (details best left to the imagination). Like any 10-year-old, I rallied quickly. I didn’t view the experience as a disaster, but as an opportunity to replenish what I lost with another funnel cake. This time with extra powdered sugar.
The Ring of Fire was the wildest ride I’d experienced—until “Liberation Day” on April 2 sent fixed income markets into a tailspin.
The market volatility drove municipal yields to levels we haven’t seen since the Global Financial Crisis. Just like a heavily sugared funnel cake after a terrifying roller-coaster, yields at these levels present real opportunities for investors. The chart below shows four previous entry points into the municipal market with roughly comparable yields to the current market’s. The table following the chart shows the subsequent five-year annualized returns following each of those entry points.
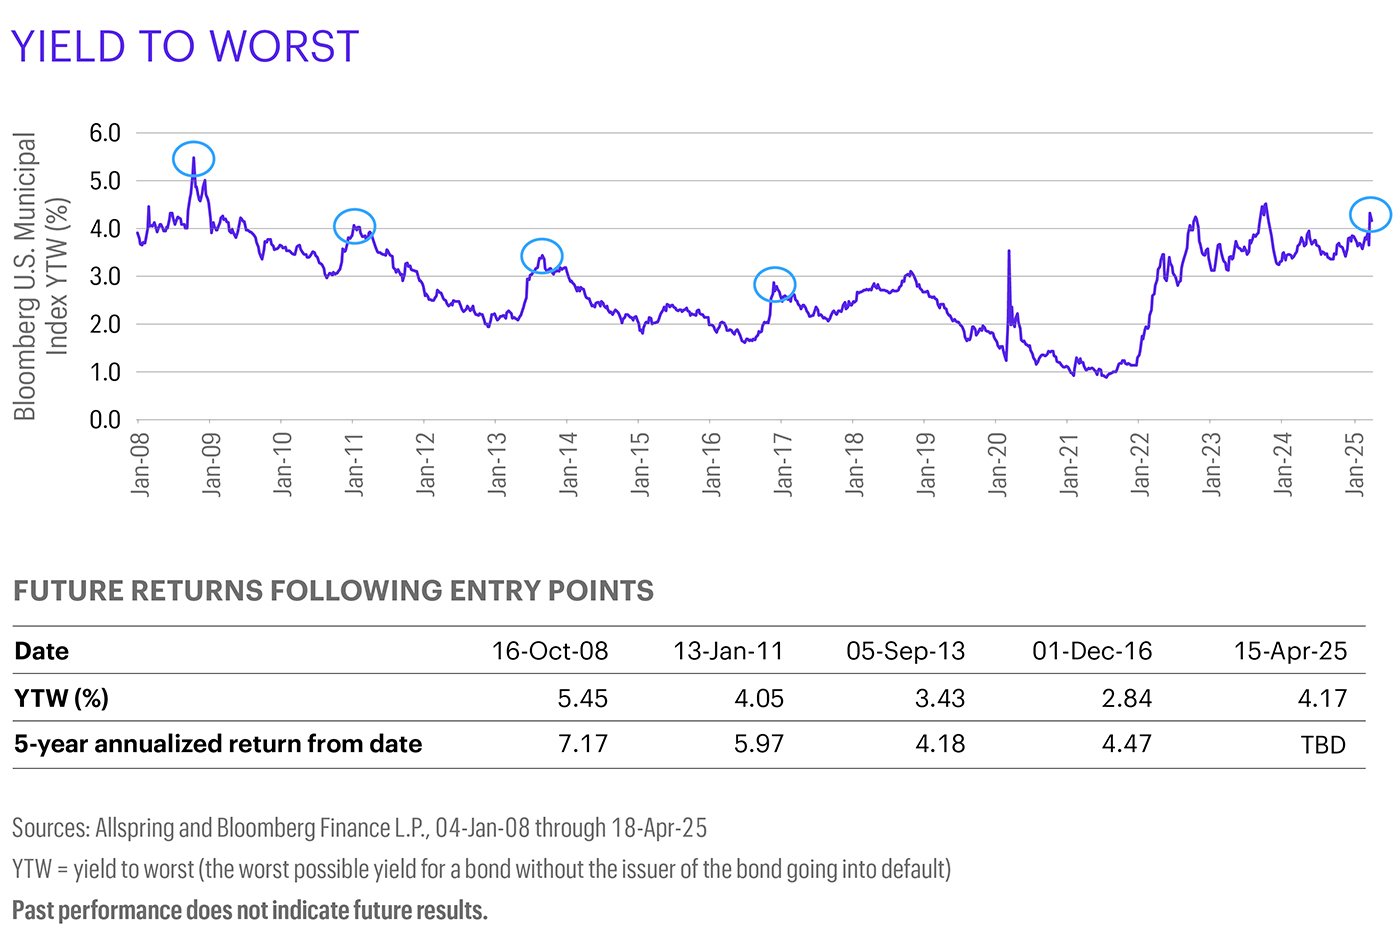
These compelling returns are even more so when you recognize they’re not adjusted for the tax benefit that municipal bonds can provide. For investors in the upper tax brackets, the potential to flirt with equity-like returns for muni-like risks is a possibility.
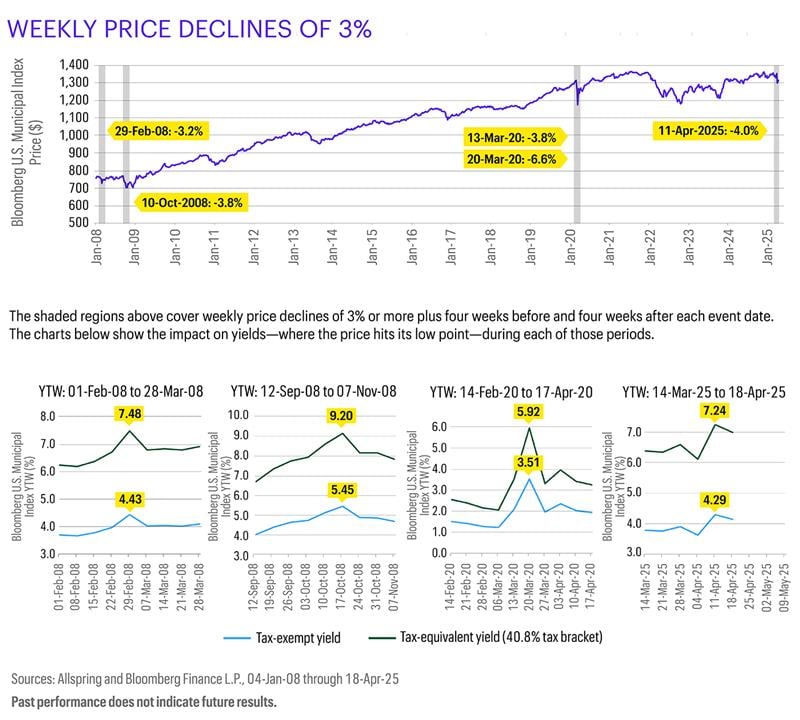
Opportunities like this don’t come around often. The chart below takes a historical look at periods when the Bloomberg Municipal Bond Index experienced a 3% or larger weekly decline. The corresponding price declines were met with a rapid increase in yields available to investors. Those yields (currently 4.29%, or a tax-adjusted 7.24% based on a 40.8% tax bracket) could potentially create a very interesting forward-looking return profile.
If there were ever a time for more funnel cake—oops, I mean municipal bonds—that time may be now.
This material is provided for informational purposes only and is intended for retail public distribution in the United States. Use outside the United States is for professional/qualified investors only.
ALL-04232025-yl35dc29
Related insights

George Bory explains why bond markets in 2026 should favor discipline and flexibility. Positive real yields, global policy divergence, and credit dispersion may create opportunities for income generation and selective positioning.

Janet Rilling and Hannah Rosencrantz give a Q3 fixed income market update—discussing strong bond performance, potential risks in credit compensation, and strategies for building resilient portfolios in Q4.

Fixed income benchmark construction has two fundamental flaws. First, exposures prioritize the needs of borrowers rather than investors. Second, this tends to expose investors to the biggest risks at the worst times.

Two of Allspring’s senior portfolio managers and high yield specialists, Chris Lee and Mike Schueller, sit down with Daniel Sarnowski to discuss recent volatility and why focusing on shorter-duration, higher-quality high yield assets could be the answer in uncertain markets.
Nick Venditti, Allspring’s head of Municipal Fixed Income, explains the impact of the recently passed One, Big, Beautiful Bill on our SpringTalk Muni Moments. And the good news for muni investors? It’s not bad news.
After a mid-April “tariff tantrum,” bond markets appear to be moving past trade headlines and turning their attention to upcoming tax policy and budget negotiations.

George Bory, chief investment strategist for Allspring Fixed Income, explains how active investing in fixed income can offer key advantages over passive investing by prioritizing investor needs, accounting for opportunity costs, and exploiting structural inefficiencies within the bond market.
Nick Venditti, head of Municipal Fixed Income, delves into the recent volatility in the fixed income markets in this episode of Allspring Muni Moments. With elevated yields and favorable muni-to-Treasury ratios, Nick highlights why now might be the time to explore municipal fixed income investments.
Nick Venditti, head of Municipal Fixed Income at Allspring Global Investments, talks about how, for the first time in a while, the higher education sector is starting to show signs of distress.

Allspring's Plus Fixed Income team explains the three key elements they believe may lead to a more balanced and enhanced return profile.

Allspring's Plus Fixed Income team explains why they believe now is the time to utilise an unconstrained multi-sector approach to uncover opportunities in global fixed income.