Income Generator: Bonds, by Design
George Bory explains why bond markets in 2026 should favor discipline and flexibility. Positive real yields, global policy divergence, and credit dispersion may create opportunities for income generation and selective positioning.

Key takeaways
- Positive real yields make bonds compelling: With yields above inflation across the curve, investors can secure steady income without relying on falling rates or credit spreads to drive bond returns.
- Flexibility and selectivity may be critical: Diverging global monetary policies and rising credit dispersion require disciplined curve management and issuer selection.
- Municipal bonds offer relative value: Taxable and tax-exempt munis may provide strong credit profiles, attractive yields, and diversification benefits for income-focused portfolios.
Dispersion and the case for discipline
As the year ahead comes into view, we believe the backdrop for fixed income remains complex but broadly supportive. Growth is decelerating, inflation is stable but still above target, and policy paths are increasingly uneven across regions. In this environment, bonds continue to offer real value. Nominal yields remain high by historical standards, real yields are firmly positive, and income generation is likely to remain the primary driver of returns.
This is not a market that we believe requires aggressive duration calls. Instead, we think it favors discipline and flexibility: capturing income, managing the curve carefully, and responding quickly to risks that may emerge as the cycle matures.
Growth near trend, but little margin for error
Economic growth in the U.S. is close to trend and may even accelerate modestly in the coming year. At the same time, the balance of risk remains asymmetric. A meaningful slowdown is not the base case, but given tighter financial conditions, elevated debt levels, and ongoing geopolitical uncertainty, it cannot be ruled out.
For bond investors, this asymmetry is encouraging. If growth remains resilient, income should do most of the work. If growth disappoints, duration may provide downside protection. In this sense, bonds are not dependent on a single macroeconomic outcome to justify a substantial role in portfolios.
Inflation and policy: Easing, but cautiously
Inflation remains above central bank targets, but the trend appears to be one of gradual deceleration rather than renewed acceleration. This leaves policymakers navigating a narrow path. In the U.S., the Federal Reserve (Fed) retains an easing bias, but the timing and pace of further rate cuts remain uncertain. Fed Chair Powell’s observation that there is “no risk-free path for policy” still applies.
Rather than focusing on the precise number of rate cuts, we believe a more useful exercise is to consider how policy expectations affect behavior, particularly at the front end of the curve. As policy rates move closer to neutral, real yields on cash compress. When real yields at the front end turn negative—either outright or on a tax-adjusted basis—investors historically begin to look further out on the curve or toward other income-producing assets.
Real yields remain firmly positive across yield curve
Income can work even without falling yields to drive returns.
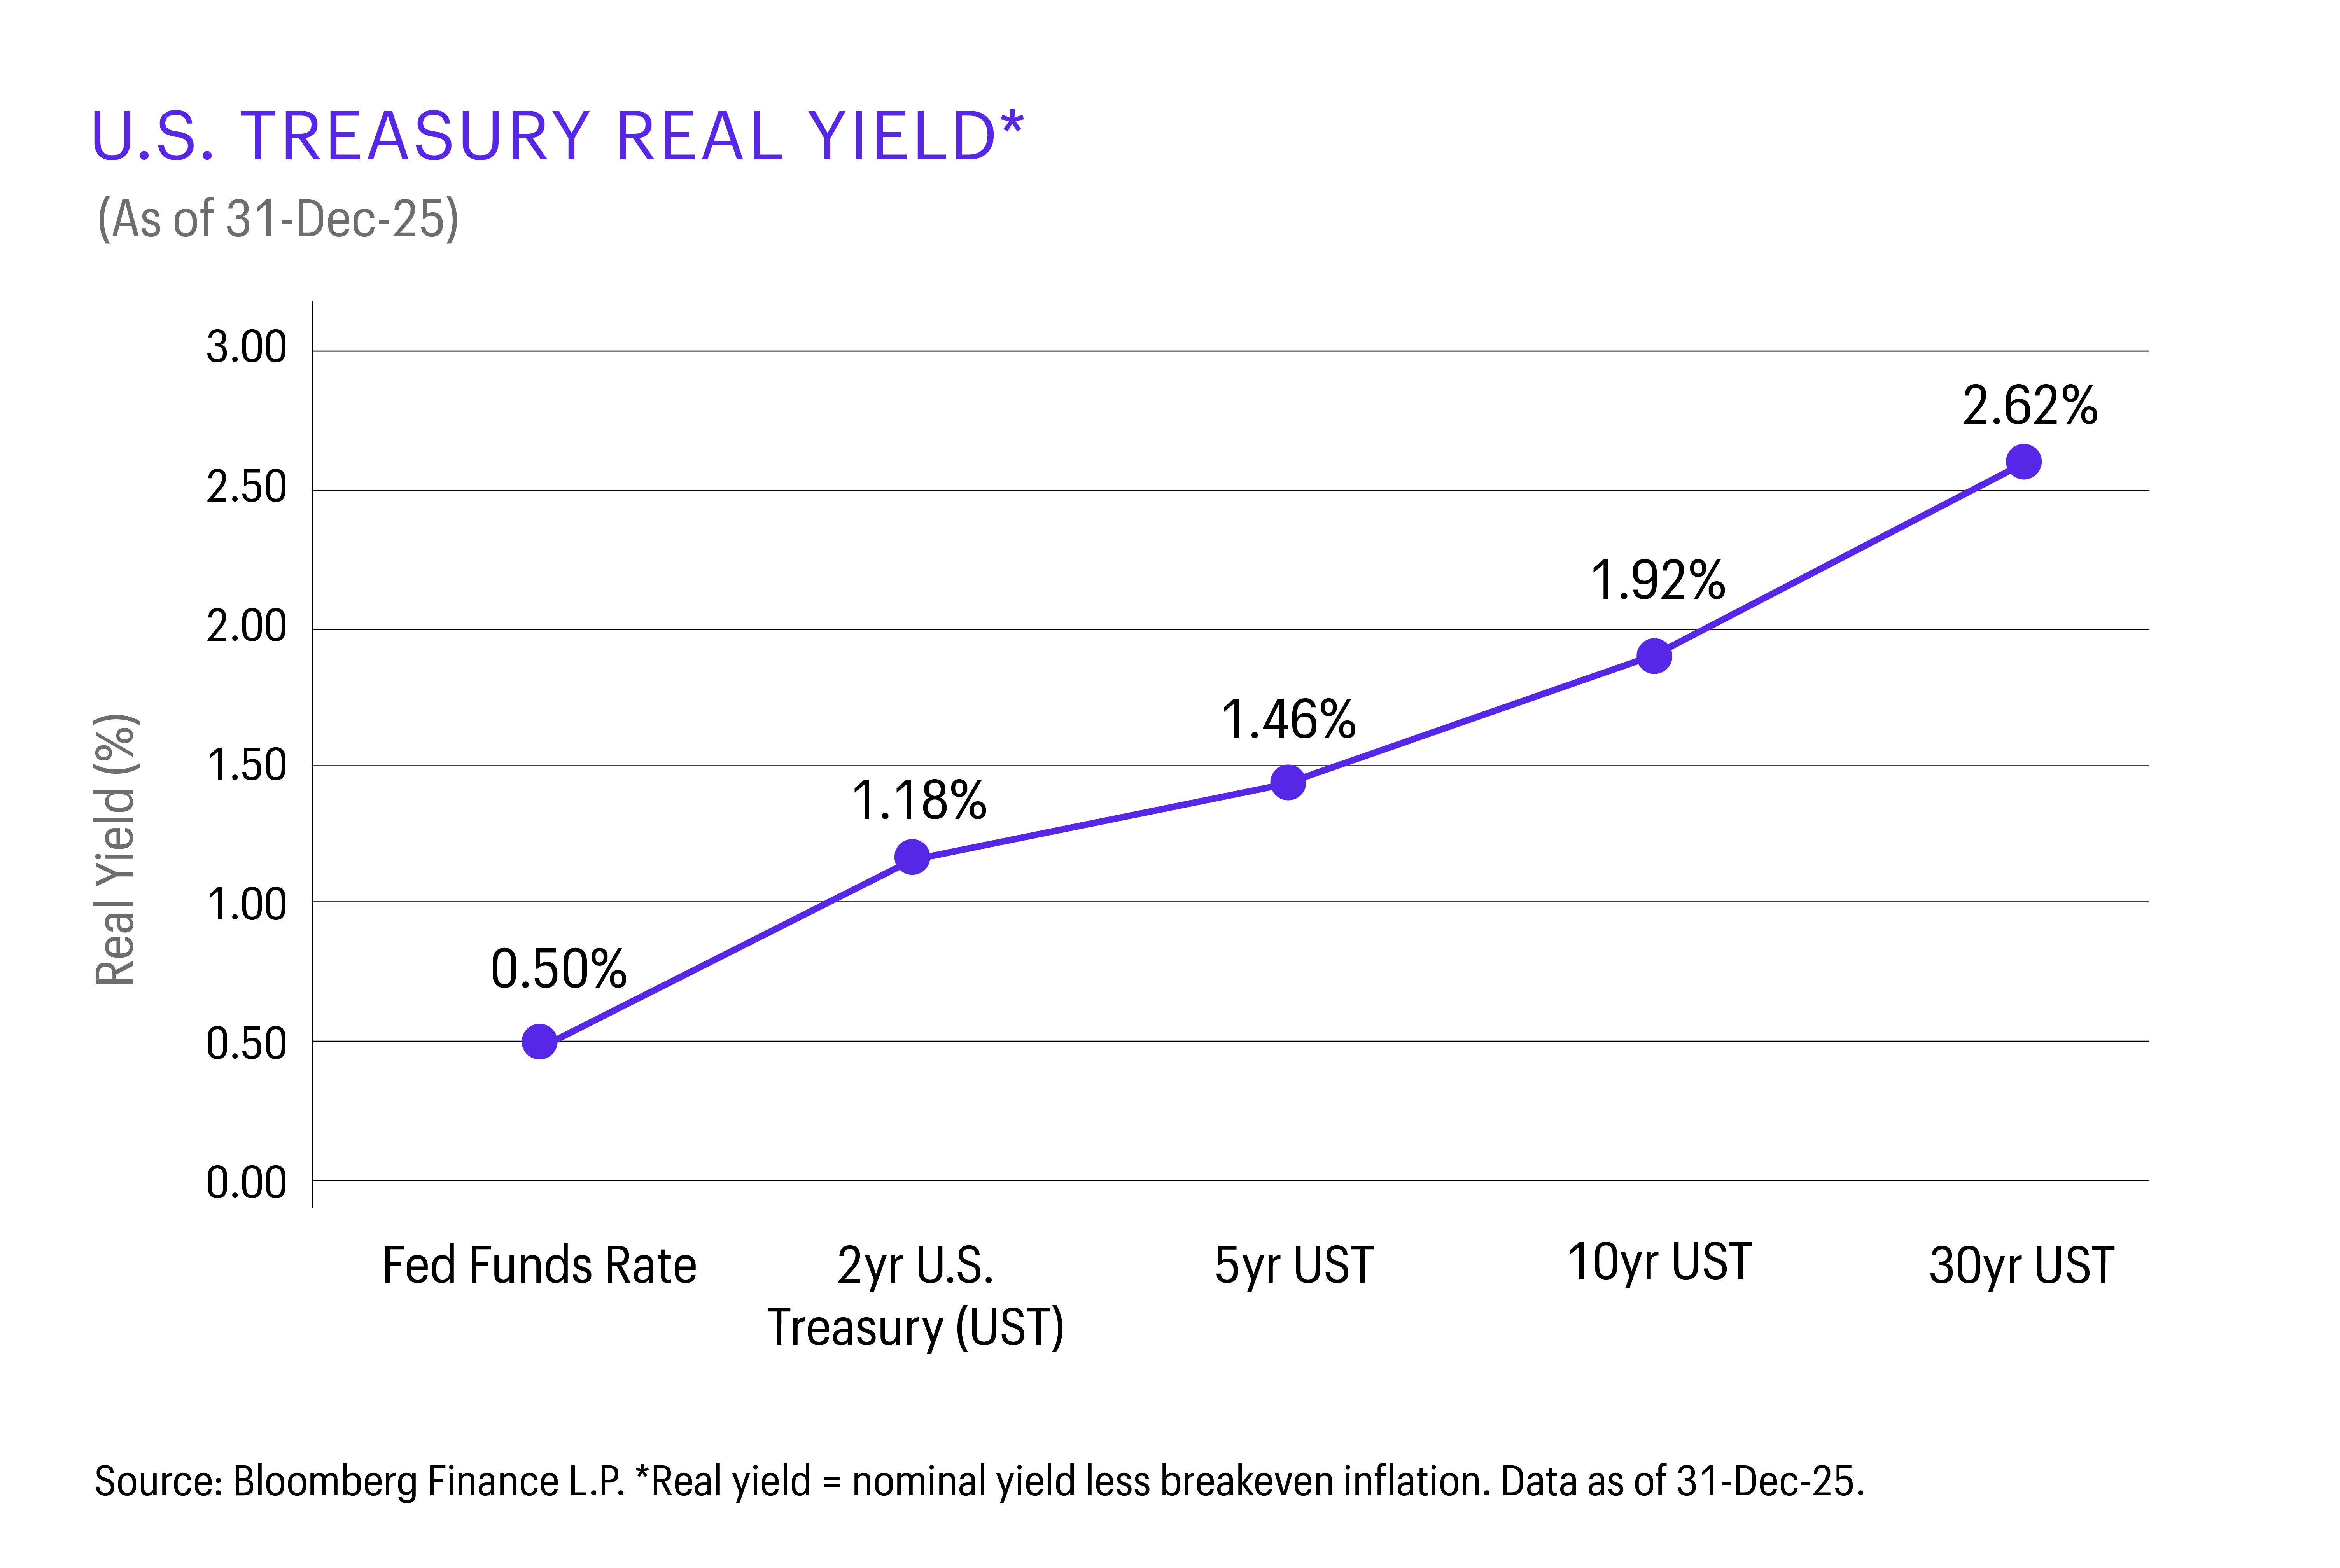
With nearly $8 trillion of capital still sitting in cash-like instruments1, incremental shifts in real yields could have outsized implications for bond demand.
Diverging central banks mean diverging opportunities
Global monetary policy is no longer moving in lockstep. While the Fed remains accommodative, Europe is largely on hold and Japan continues to tighten. Other developed and emerging markets reflect their own growth and inflation dynamics.
For fixed income portfolios, this divergence presents a useful source of diversification. Distinct policy paths translate into different yield curves, different breakeven points, and different risk profiles. To be effective, global diversification is less about making top-down macro bets and more about selecting specific points along yield curves where valuations and fundamentals align.
Valuations anchored by real income
Bond valuations remain favorable, primarily because real yields are positive across much of the market. Depending on sector and maturity, real yields generally range from roughly 150–400 basis points (bps; 100 bps equal 1.00%). That starting point matters. It allows investors to generate durable cash flows without relying on lower yields or tighter spreads.
Lower yields and higher prices are possible, but they are not our base case. Instead, the math works even if yields remain range-bound. When viewed relative to volatility, the breakeven for many bonds still looks constructive, reinforcing the case for staying invested rather than waiting for a more dramatic dislocation.
Credit: Late cycle, rising dispersion
Credit spreads are tight relative to history, and the credit cycle appears mature. However, maturity does not always imply imminent broad-based stress. In our view, the next phase of the cycle is likely to be defined by dispersion.
Performance dispersion started to increase in 2025
Different segments of the credit market respond to changing macro dynamics.
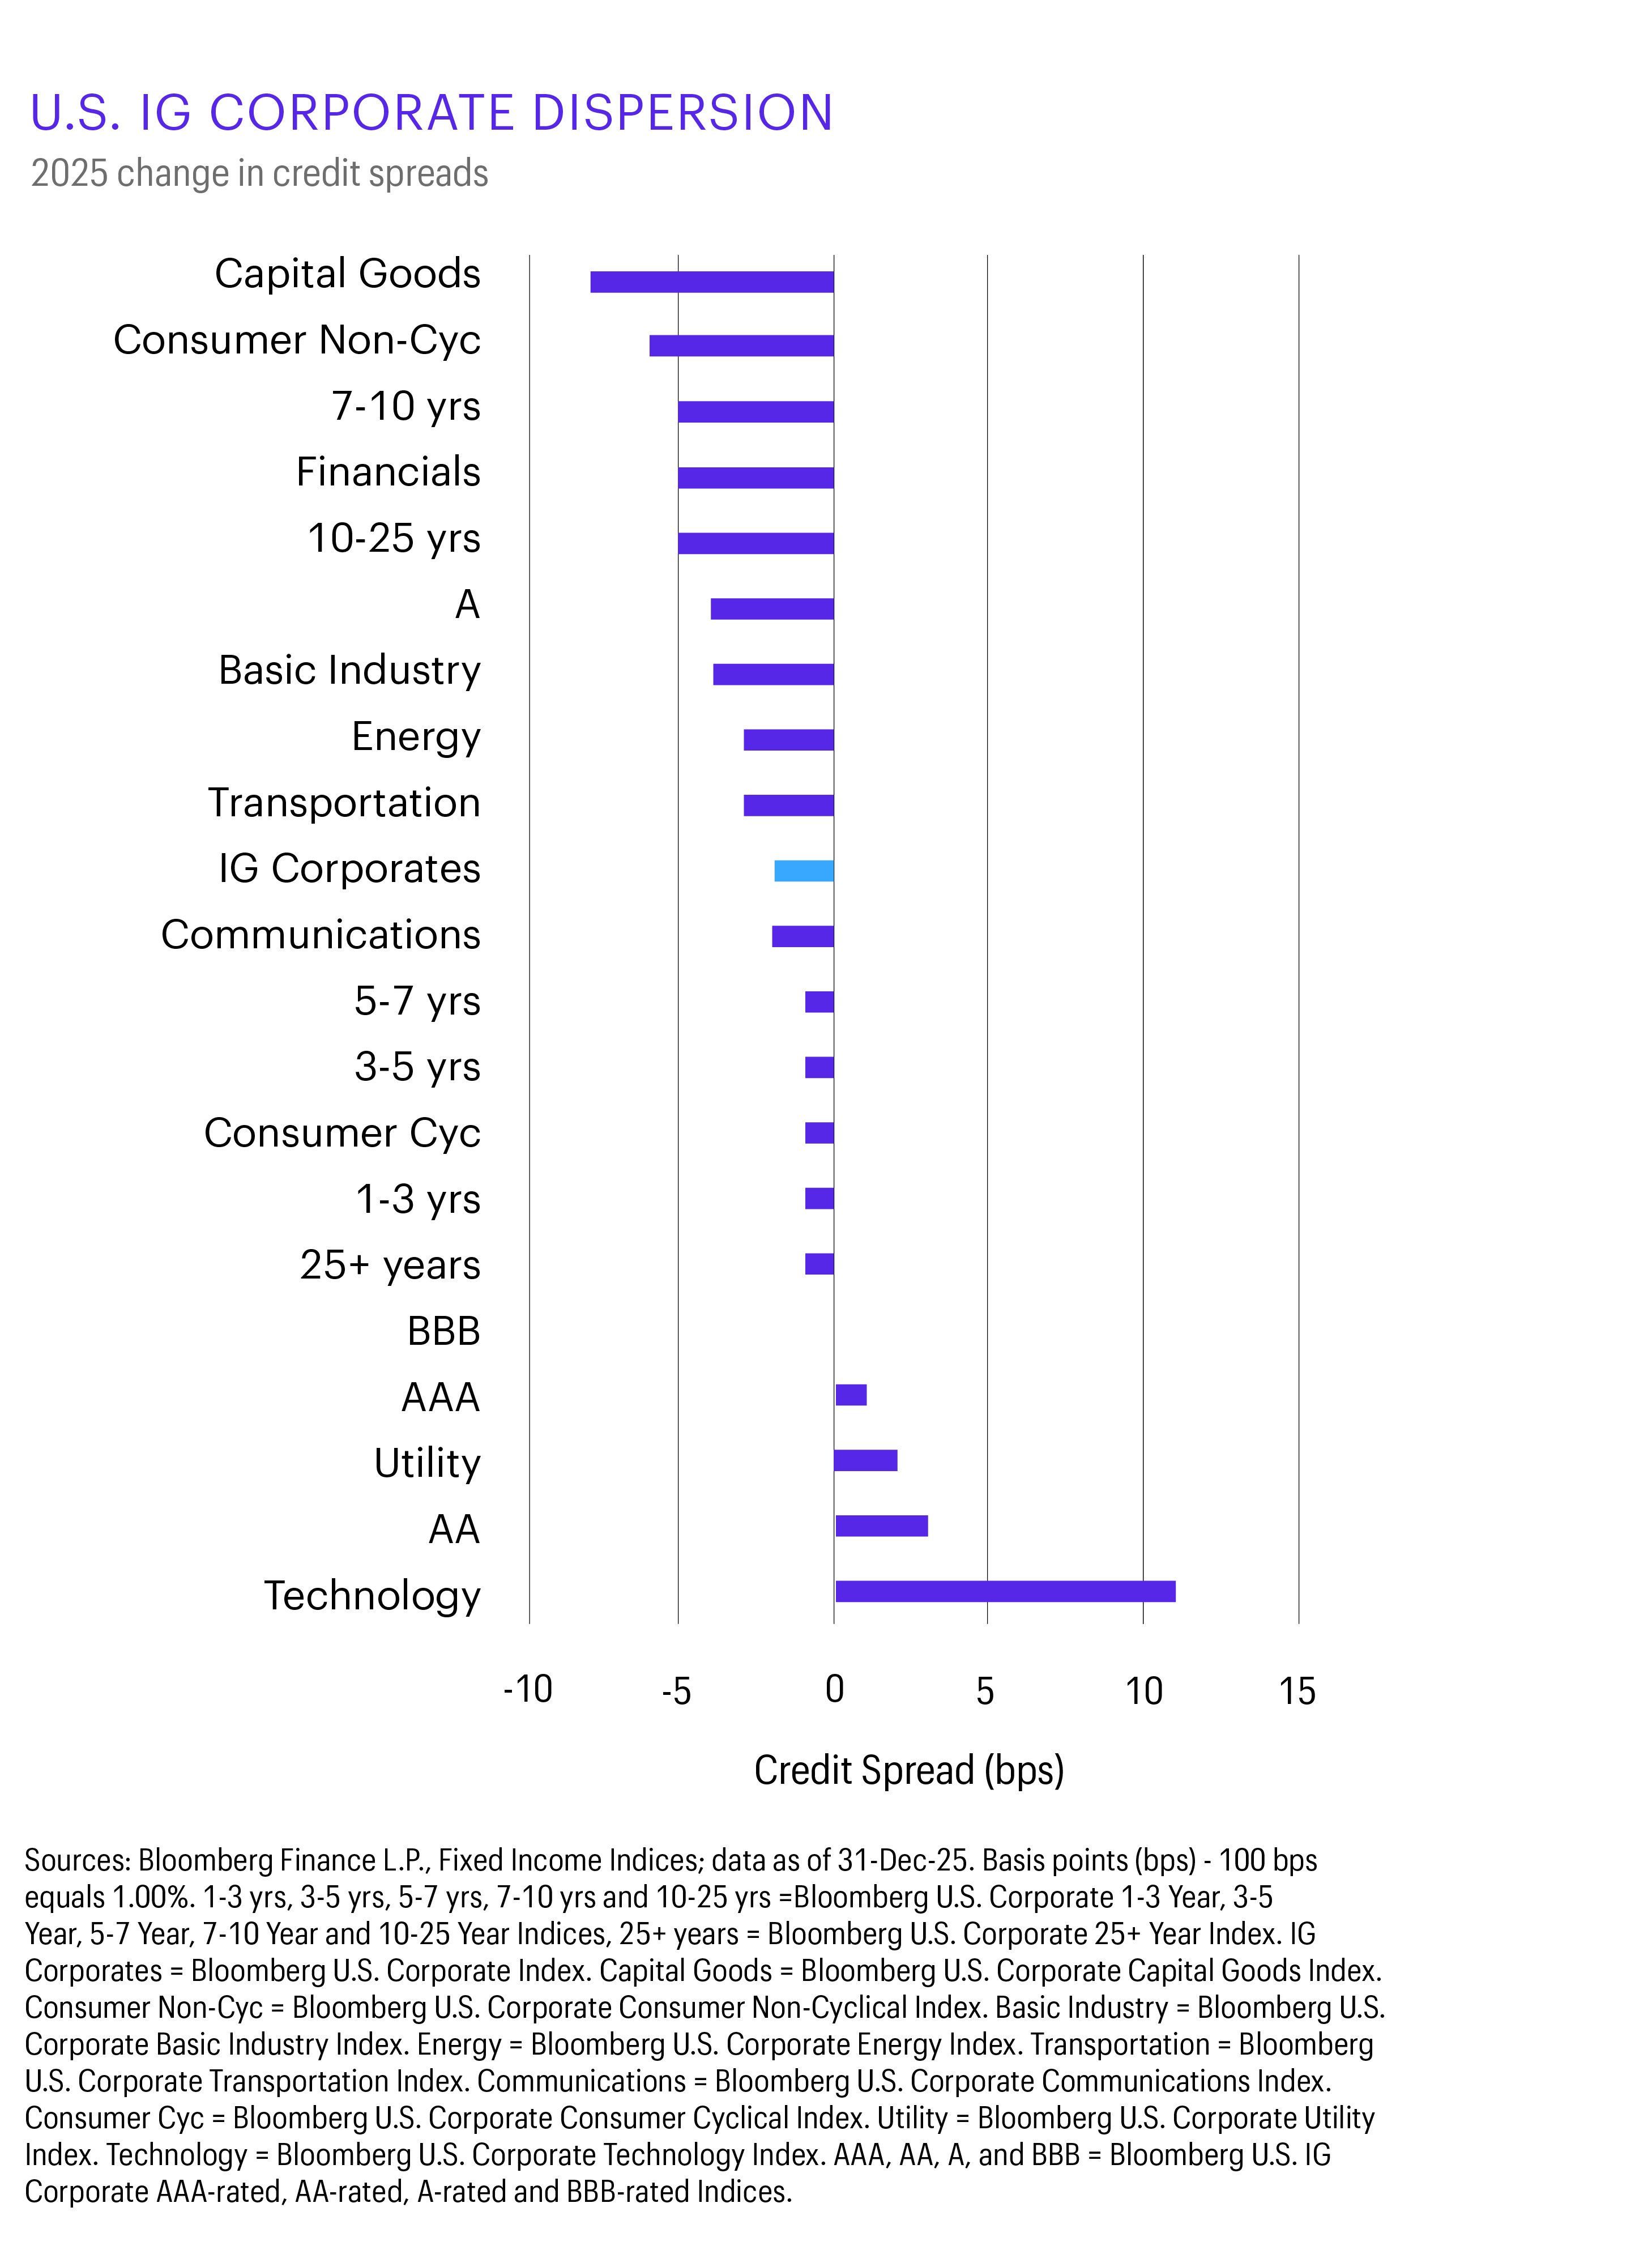
Several forces are contributing to this dynamic. The real cost of debt has risen sharply. Balance sheets are more leveraged. Merger and acquisition activity has accelerated. Capital expenditures, particularly related to artificial intelligence infrastructure, remain substantial. Together, these pressures increase the likelihood of idiosyncratic events, even if aggregate default rates remain contained.
This is further evidence that selectivity matters in this environment. Preserving quality and focusing on issuers with resilient balance sheets and more predictable cash flows can help ensure that stated yields translate into realized returns.
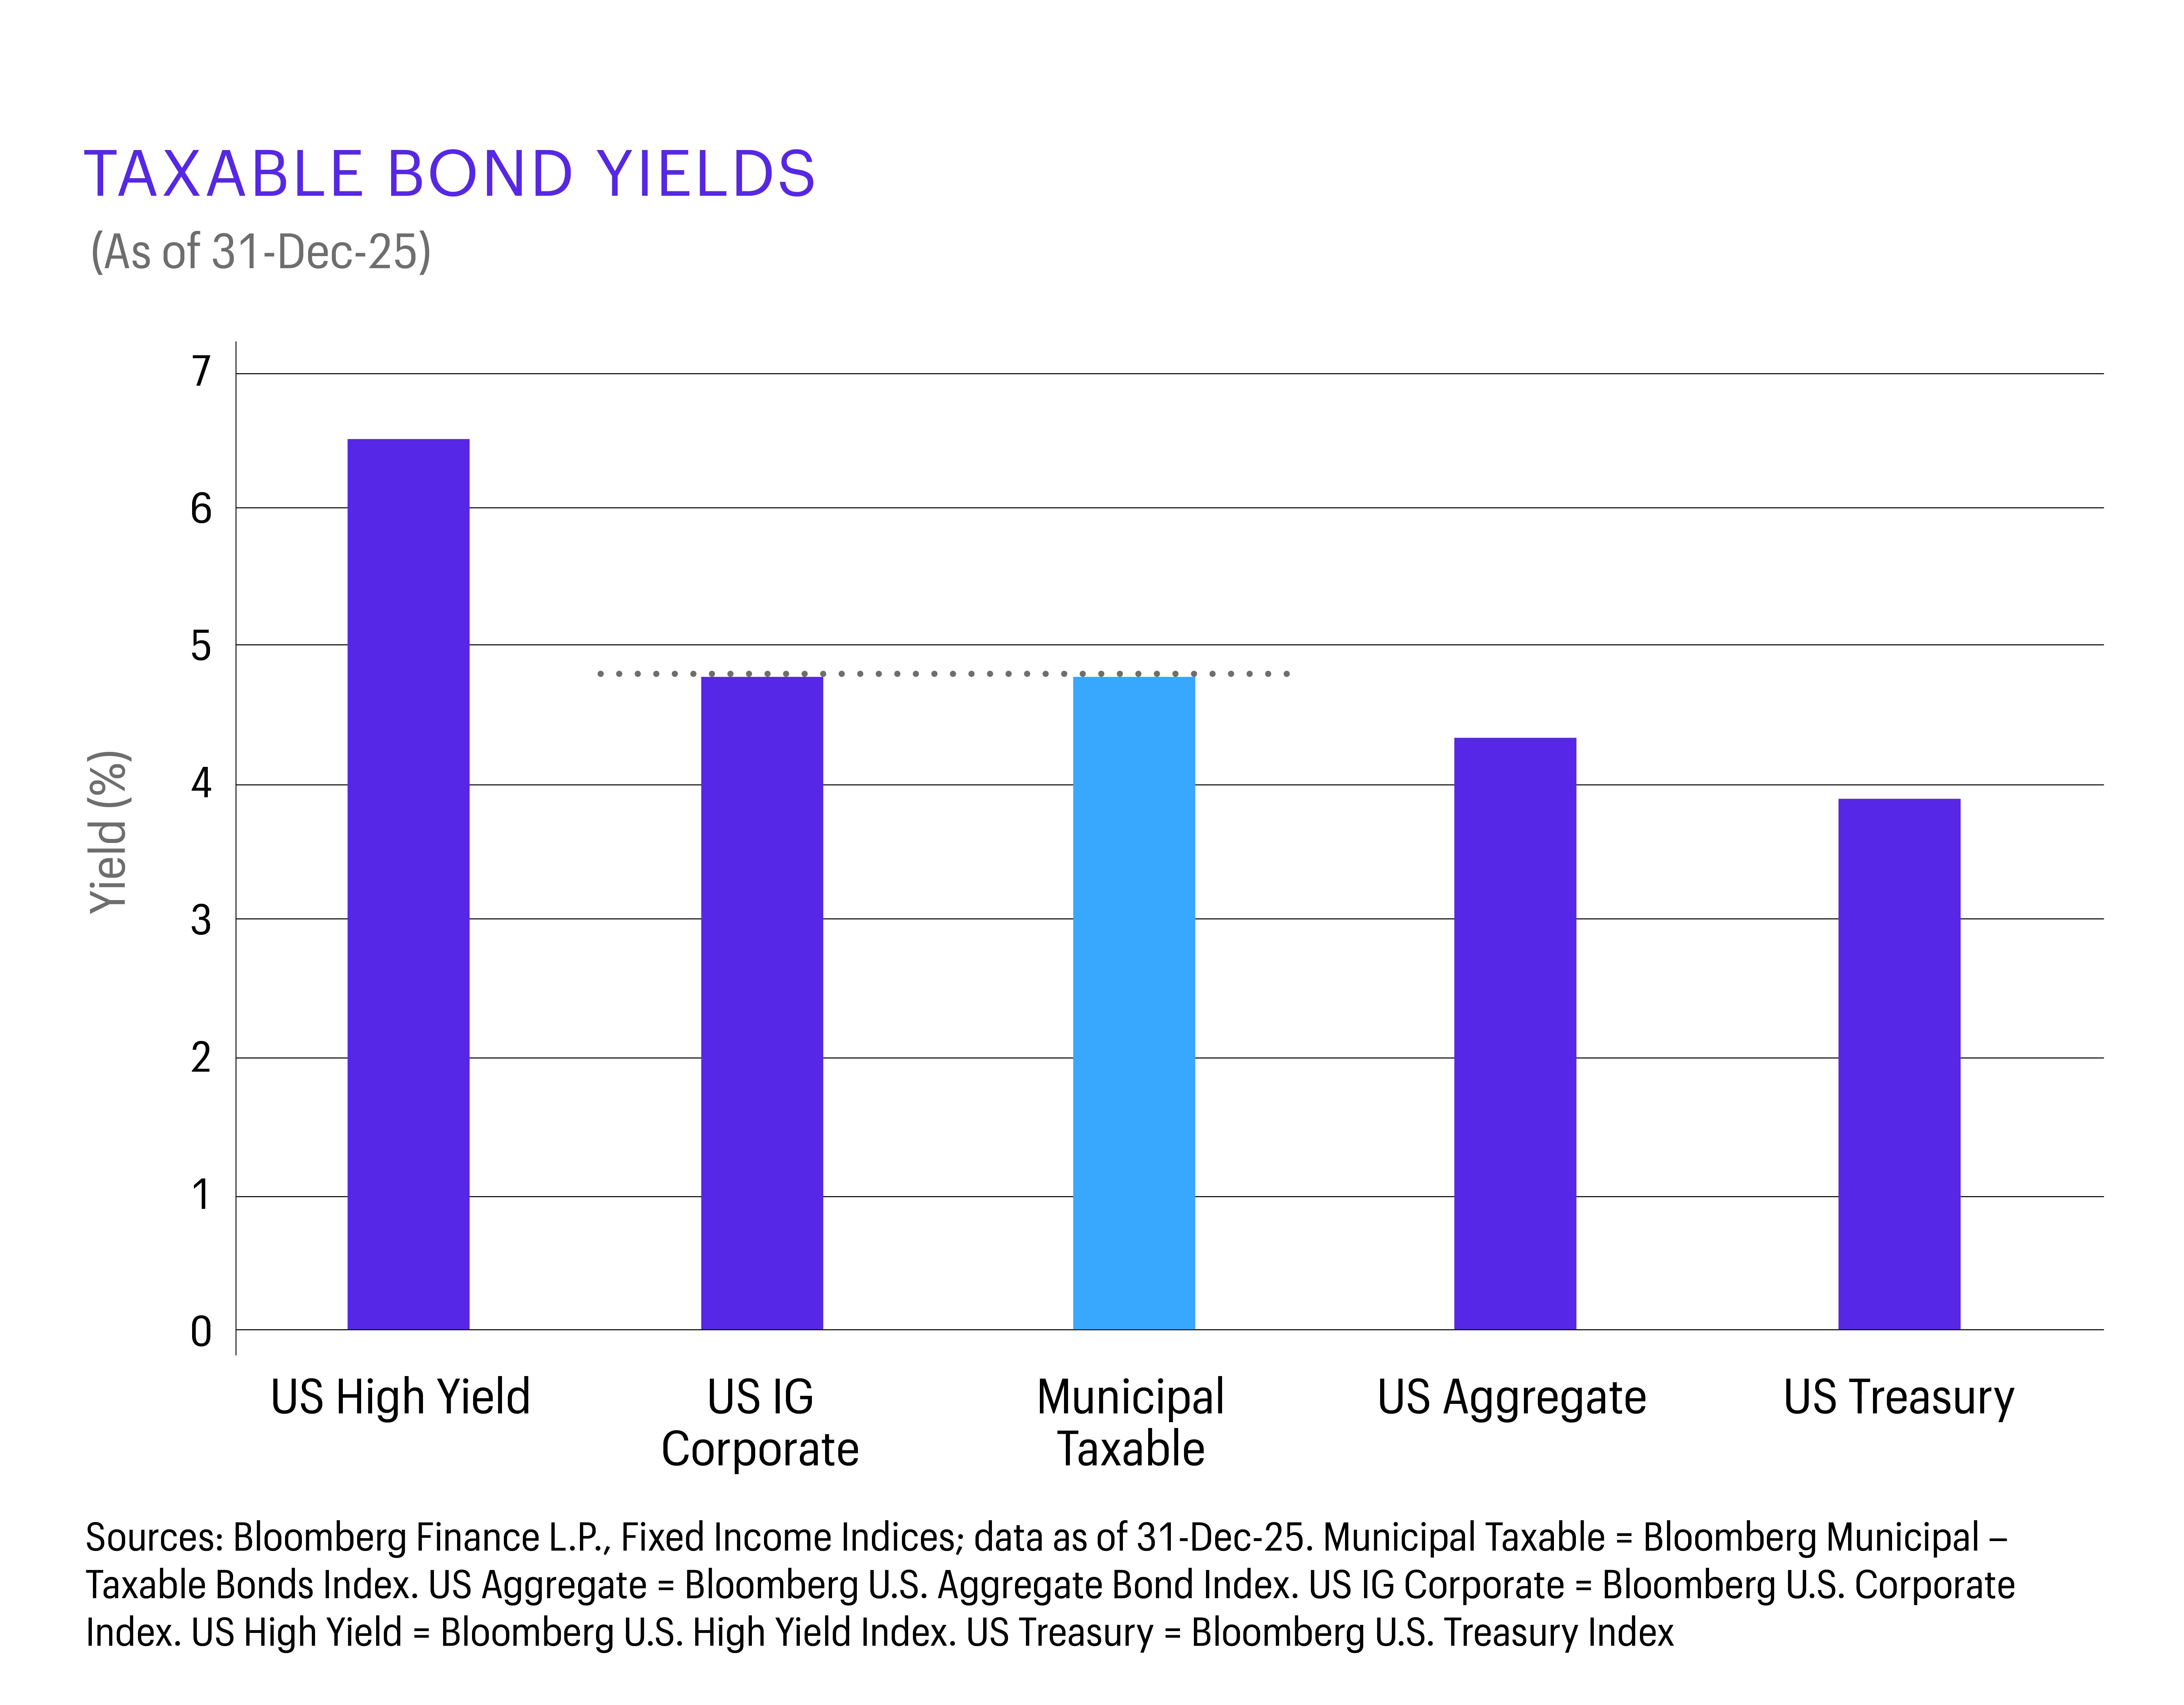
Municipal bonds may provide relative value with structural support
We believe municipal bonds currently offer some of the clearest relative value in fixed income. Many taxable municipal bonds with yields in line with investment-grade corporates are carrying higher average credit ratings. Balanced budget requirements, lower net issuance, and improving fundamentals further support the sector.
For tax-sensitive investors, tax-exempt municipals offer attractive after-tax income. Beyond yield, munis provide diversification benefits: Revenues tied to essential services and taxing authority often behave differently from corporate cash flows during periods of economic stress.
Taxable municipal yields vs. Investment-grade corporate yields with same credit ratings
Municipal yields are similar to lower-quality corporates despite stronger credit profiles.
Consider global bonds as a diversification tool, not a macro bet
Global bond markets offer additional diversification by reflecting different economic cycles and policy regimes. Slower growth in Europe, tightening in Japan, and favorable cyclical exposure in select emerging markets create a broad opportunity set.
The objective is not to identify a single winner but to reduce dependence on any one outcome. When combined thoughtfully, global exposures may improve portfolio resilience and could help smooth returns through varying market environments.
A market that rewards flexibility
With few obvious dislocations and tight risk premiums across many sectors, returns in 2026 are likely to be driven more by relative positioning than by broad beta exposure. We believe sector allocation, issuer selection, and curve positioning matter more as the cycle matures.
Therefore, it is our view that this is not a set-it-and-forget-it environment. Indeed, portfolios should be positioned to adapt as conditions evolve rather than anchored to a single forecast.
Uncertainty remains elevated. Political developments, geopolitical risks, and shifting economic conditions will continue to shape markets. Bonds are designed for exactly this type of environment.
Bloomberg U.S. Municipal Taxable Bonds Index
The Bloomberg U.S. Municipal Taxable Bonds Index measures the U.S. municipal taxable investment-grade bond market with an effective maturity of at least one year. You cannot invest directly in an index.
Bloomberg U.S. Aggregate Bond Index
he Bloomberg U.S. Aggregate Bond Index is a broad-based benchmark that measures the investment-grade, USD-denominated, fixed-rate taxable bond market, including Treasuries, government-related and corporate securities, mortgage-backed securities (agency fixed-rate and hybrid adjustable-rate mortgage pass-throughs), asset-backed securities, and commercial mortgage-backed securities. You cannot invest directly in an index.
Bloomberg U.S. Corporate 1–3 Years, 3–5 Years, 5–7 Years, 7–10 Years, and 10–25 Years Indexes
The Bloomberg U.S. Corporate 1–3 Years, 3–5 Years, 5–7 Years, 7–10 Years, and 10–25 Years Indexes measure the performance of investment-grade securities that are selected by a market value process with maturities of 1–3 years, 3–5 years, 5–7 years, 7–10 years, and 10–25 years, respectively. The indexes include publicly issued USD-denominated corporate issues that have a remaining maturity of greater than or equal to the lowest range of years described and less than the highest range of years described, are rated investment grade (must be Baa3/BBB- or higher using the middle rating of Moody’s Ratings, Standard & Poor’s, and Fitch Ratings), and have $250 million or more of outstanding face value. You cannot invest directly in an index.
Bloomberg U.S. Corporate 25+ Years Index
The Bloomberg U.S. Corporate 25+ Years Index measures the performance of the investment-grade, USD-denominated, fixed-rate, taxable corporate bond market securities with maturities of 25 years and greater. You cannot invest directly in an index.
Bloomberg U.S. Corporate Bond Index
The Bloomberg U.S. Corporate Bond Index measures the investment-grade, fixed-rate, taxable corporate bond market. It includes USD-denominated securities publicly issued by U.S. and non-U.S. industrials, utilities, and financials issuers. You cannot invest directly in an index.
Bloomberg U.S. Corporate Capital Goods Index
The Bloomberg U.S. Corporate Capital Goods Index measures the investment-grade, fixed-rate, taxable corporate bond market with a Bloomberg classification of Capital Goods. The index is a subset of the U.S. Credit and U.S. Aggregate Indexes. You cannot invest directly in an index.
Bloomberg U.S. Corporate Consumer Non-Cyclical Index
The Bloomberg U.S. Corporate Consumer Non-Cyclical Index measures the investment-grade, fixed-rate, taxable corporate bond market with a Bloomberg classification of Consumer Non-Cyclical. The index is a subset of the U.S. Credit and U.S. Aggregate Indexes. You cannot invest directly in an index.
Bloomberg U.S. Corporate Financials Index
The Bloomberg U.S. Corporate Financials Index measures the investment-grade, fixed-rate, taxable corporate bond market with a Bloomberg classification of Financials. The index is a subset of the U.S. Credit and U.S. Aggregate Indexes. You cannot invest directly in an index.
Bloomberg U.S. Corporate Basic Industry Index
The Bloomberg U.S. Corporate Basic Industry Index measures the investment-grade, fixed-rate, taxable corporate bond market with a Bloomberg classification of Basic Industry. The index is a subset of the U.S. Credit and U.S. Aggregate Indexes. You cannot invest directly in an index.
Bloomberg U.S. Corporate Energy Index
The Bloomberg U.S. Corporate Energy Index measures the investment-grade, fixed-rate, taxable corporate bond market with a Bloomberg classification of Energy. The index is a subset of the U.S. Credit and U.S. Aggregate Indexes. You cannot invest directly in an index.
Bloomberg U.S. Corporate Transportation Index
The Bloomberg U.S. Corporate Transportation Index measures the investment-grade, fixed-rate, taxable corporate bond market with a Bloomberg classification of Transportation. The index is a subset of the U.S. Credit and U.S. Aggregate Indexes. You cannot invest directly in an index.
Bloomberg U.S. Corporate Communications Index
The Bloomberg U.S. Corporate Communications Index measures the investment-grade, fixed-rate, taxable corporate bond market with a Bloomberg classification of Communications. The index is a subset of the U.S. Credit and U.S. Aggregate Indexes. You cannot invest directly in an index.
Bloomberg U.S. Corporate Consumer Cyclical Index
The Bloomberg U.S. Corporate Consumer Cyclical Index measures the investment-grade, fixed-rate, taxable corporate bond market with a Bloomberg classification of Consumer Cyclical. The index is a subset of the U.S. Credit and U.S. Aggregate Indexes. You cannot invest directly in an index.
Bloomberg U.S. Corporate Utility Index
The Bloomberg U.S. Corporate Utility Index measures the investment-grade, fixed-rate, taxable corporate bond market with a Bloomberg classification of Utility. The index is a subset of the U.S. Credit and U.S. Aggregate Indexes. You cannot invest directly in an index.
Bloomberg U.S. Corporate Technology Index
The Bloomberg U.S. Corporate Technology Index measures the investment-grade, fixed-rate, taxable corporate bond market with a Bloomberg classification of Technology. The index is a subset of the U.S. Credit and U.S. Aggregate Indexes. You cannot invest directly in an index.
Bloomberg U.S. Credit Index
The Bloomberg U.S. Credit Index contains publicly issued U.S. corporate and specified foreign debentures and secured notes that meet the specified maturity, liquidity, and quality requirements. To qualify, bonds must be registered with the SEC. Each qualified issuer’s exposure is then capped on a market-weighted basis at 3%, and the residual is allocated on a pro-rata basis to all remaining constituents. You cannot invest directly in an index.
Bloomberg U.S. High Yield Index
The Bloomberg U.S. High Yield Index covers the universe of fixed-rate, non-investment-grade debt. Eurobonds and debt issues from countries designated as emerging markets are excluded, but Canadian and global bonds of issuers in non–emerging market countries are included. You cannot invest directly in an index.
Bloomberg U.S. IG Corporate AAA-Rated, AA-Rated, A-Rated, and BBB-Rated Indexes
The Bloomberg U.S. IG Corporate AAA-Rated, AA-Rated, A-Rated, and BBB-Rated Indexes measure the fixed-rate, taxable corporate bond market within their respective ratings. It includes USD-denominated securities publicly issued by U.S. and non-U.S. industrials, utilities, and financials issuers. The index is a component of the U.S. Credit and U.S. Aggregate Indexes, provided the necessary inclusion rules are met. The index includes securities with a maturity of at least one year. You cannot invest directly in an index.
Bloomberg U.S. Treasury Index
The Bloomberg U.S. Treasury Index measures USD-denominated, fixed-rate, nominal debt issued by the U.S. Treasury. Treasury bills are excluded by the maturity constraint but are part of a separate Short Treasury Index. You cannot invest directly in an index.
1Source: ICI Money Market Funds Assets, as of 17-Dec-25.
This material is provided for informational purposes only and is intended for retail public distribution in the United States. Use outside the United States is for professional/qualified investors only.
ALL-01082026-ozsnt2x4
Related insights

Janet Rilling and Hannah Rosencrantz give a Q3 fixed income market update—discussing strong bond performance, potential risks in credit compensation, and strategies for building resilient portfolios in Q4.

Fixed income benchmark construction has two fundamental flaws. First, exposures prioritize the needs of borrowers rather than investors. Second, this tends to expose investors to the biggest risks at the worst times.

Two of Allspring’s senior portfolio managers and high yield specialists, Chris Lee and Mike Schueller, sit down with Daniel Sarnowski to discuss recent volatility and why focusing on shorter-duration, higher-quality high yield assets could be the answer in uncertain markets.
Nick Venditti, Allspring’s head of Municipal Fixed Income, explains the impact of the recently passed One, Big, Beautiful Bill on our SpringTalk Muni Moments. And the good news for muni investors? It’s not bad news.

After a mid-April “tariff tantrum,” bond markets appear to be moving past trade headlines and turning their attention to upcoming tax policy and budget negotiations.

George Bory, chief investment strategist for Allspring Fixed Income, explains how active investing in fixed income can offer key advantages over passive investing by prioritizing investor needs, accounting for opportunity costs, and exploiting structural inefficiencies within the bond market.
Nick Venditti, head of Municipal Fixed Income, delves into the recent volatility in the fixed income markets in this episode of Allspring Muni Moments. With elevated yields and favorable muni-to-Treasury ratios, Nick highlights why now might be the time to explore municipal fixed income investments.

The market volatility following “Liberation Day” drove municipal yields to levels not seen since the Global Financial Crisis, presenting real opportunities for investors.
Bond markets are adjusting to tariff impacts amid economic uncertainty. Fixed income investments can help protect against downturns. Expect further yield curve steepening and sector rotation. Use “Riding the Curve” solutions to help maximize income and diversify duration.
Nick Venditti, head of Municipal Fixed Income at Allspring Global Investments, talks about how, for the first time in a while, the higher education sector is starting to show signs of distress.

Allspring's Plus Fixed Income team explains the three key elements they believe may lead to a more balanced and enhanced return profile.