“California Dreamin’” … of Munis!
With California municipal bond yields near multiyear highs and California’s high income tax rates, many Californians may be interested in the attractive tax-exempt municipal bond yields available today.

Key takeaways
- For California investors in the highest federal and state tax brackets, some of their income is subject to a combined tax rate of over 51%.
- Currently, California municipal bond yields are attractive, especially when considering their taxable-equivalent yields.
- Given California’s high tax rates and its municipal bond yields near multiyear highs, Californians may want to take advantage of the taxable-equivalent yields currently available.
California is known for a lot of incredible things—the beautiful beaches and giant redwoods; the glitz and glam of Hollywood; the innovation of Silicon Valley; the majestic Sierra Nevada. I think we can add the currently attractive yields of California municipal bonds to this list as well—for now.
The Bloomberg California Municipal Bond Index’s yield was 3.88% as of May 27, 2025. For California investors in the top federal tax bracket of 37% and top California tax bracket of 13.3%, some of their income is subject to a combined tax rate of over 51%! For the portion of their income that’s subject to that 51% combined rate, the taxable equivalent of a 3.88% tax-exempt yield is 7.70%.
A taxable-equivalent yield above 7.00% on high-credit-quality, low-volatility municipal bonds is likely a compelling possibility for many investors. While we don’t know the future of tax policy, there are proposals being discussed now that would raise federal taxes on the highest-income earners.
Still California dreamin’? Then read on.
California’s municipal yields are currently attractive; the state’s tax rates are high; its economy is large and diverse; and the credit quality of California’s local governments is higher, overall, than the national average (according to S&P Global Ratings).
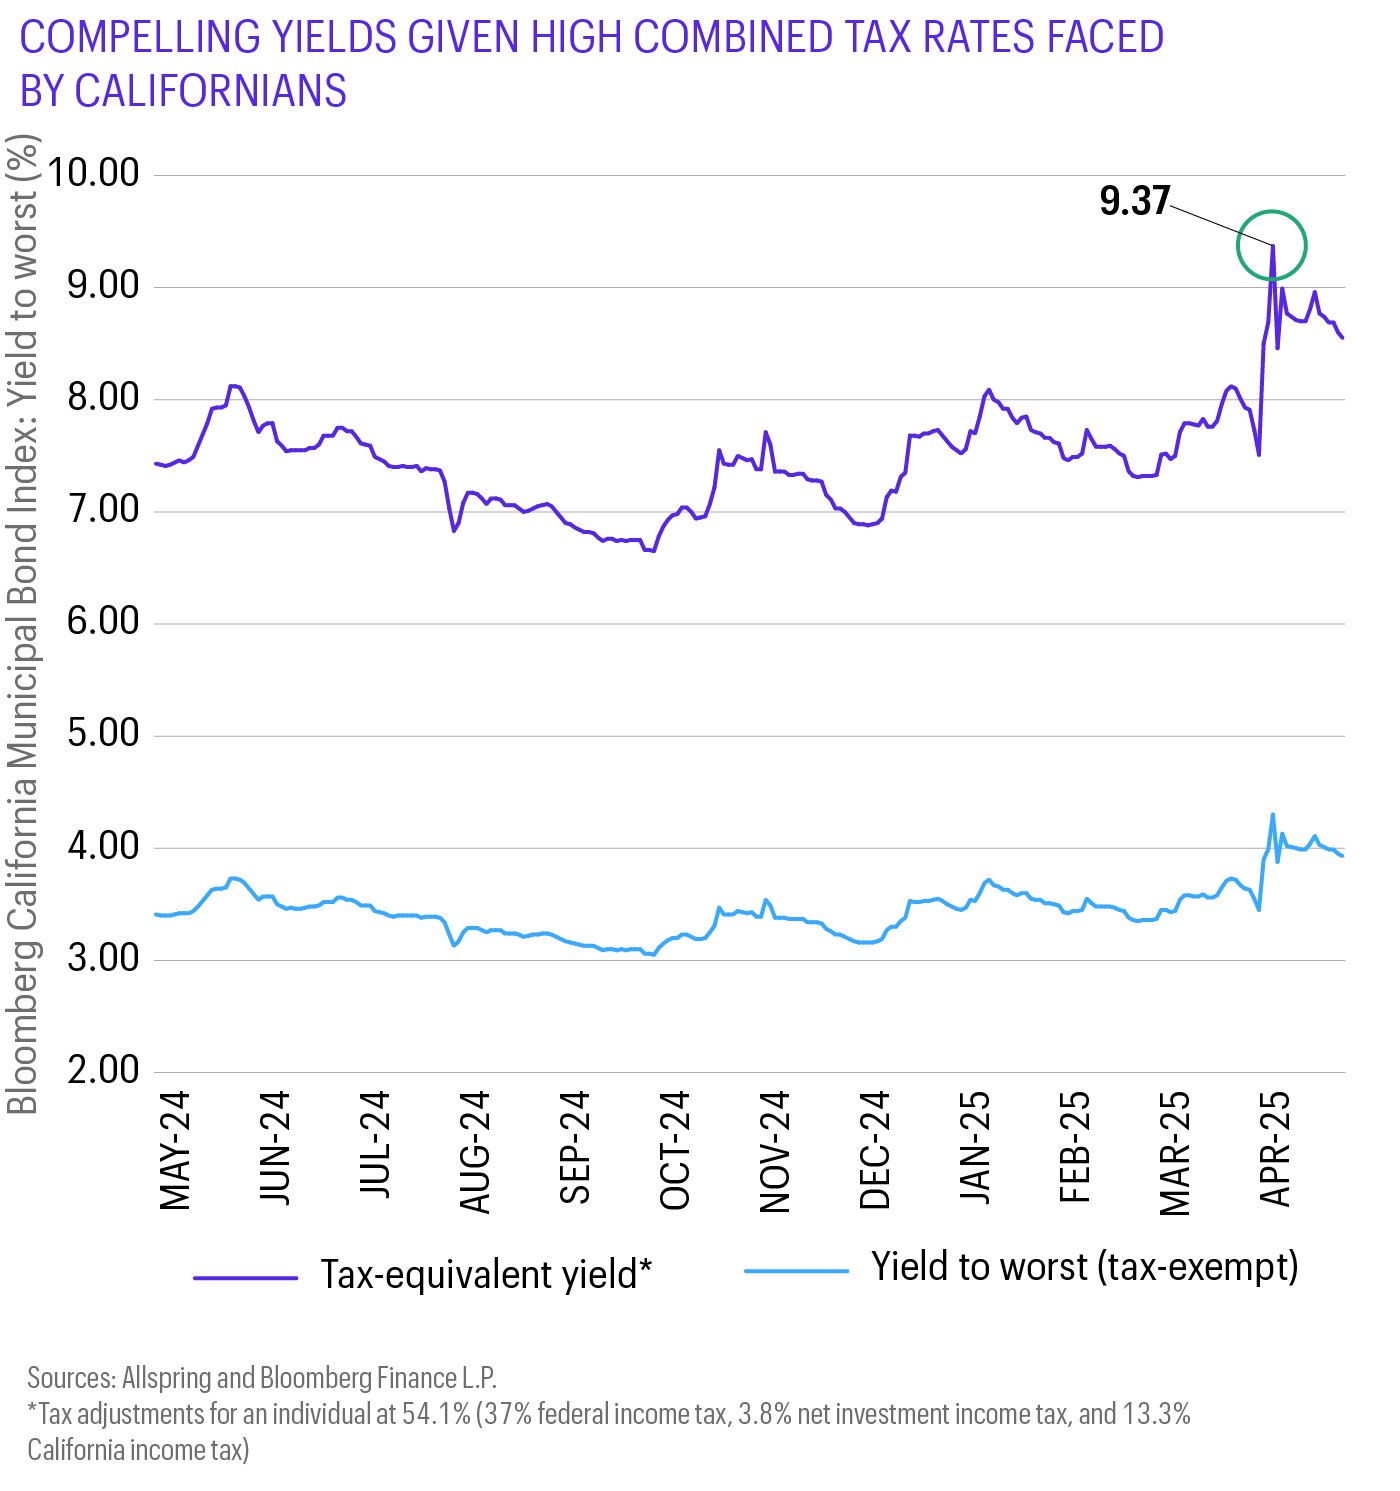
Which state’s yield to worst is approaching a three-year high?
California’s! As the chart below shows, the Bloomberg California Municipal Bond Index’s yield to worst reached a high of 4.30% on April 9, 2025, and the taxable-equivalent yield—assuming the highest federal and state tax brackets and the 3.8% net investment income tax—was an impressive 9.37%!
Which state is consistently the #1 or #2 issuer of municipal debt?
California! Whether you love or hate California general obligation (GO) bonds, there’s enough issuance in local GOs, health care, transportation, education, electric, and special tax bonds to build a well-diversified portfolio.
Which state has the most members of the Bloomberg Municipal Bond Index?
California! The state has 8,286 members. Texas is number 2 at 8,099, and New York is a distant #3 at 6,710.
Which state’s economy rivals that of most countries?
California’s! In 2024, the state’s gross domestic product was $4.1 trillion, eclipsing Japan’s $4.0 trillion. The only countries with economies larger than California’s are the U.S. ($29.2 trillion), China ($18.7 trillion), and Germany ($4.7 trillion).
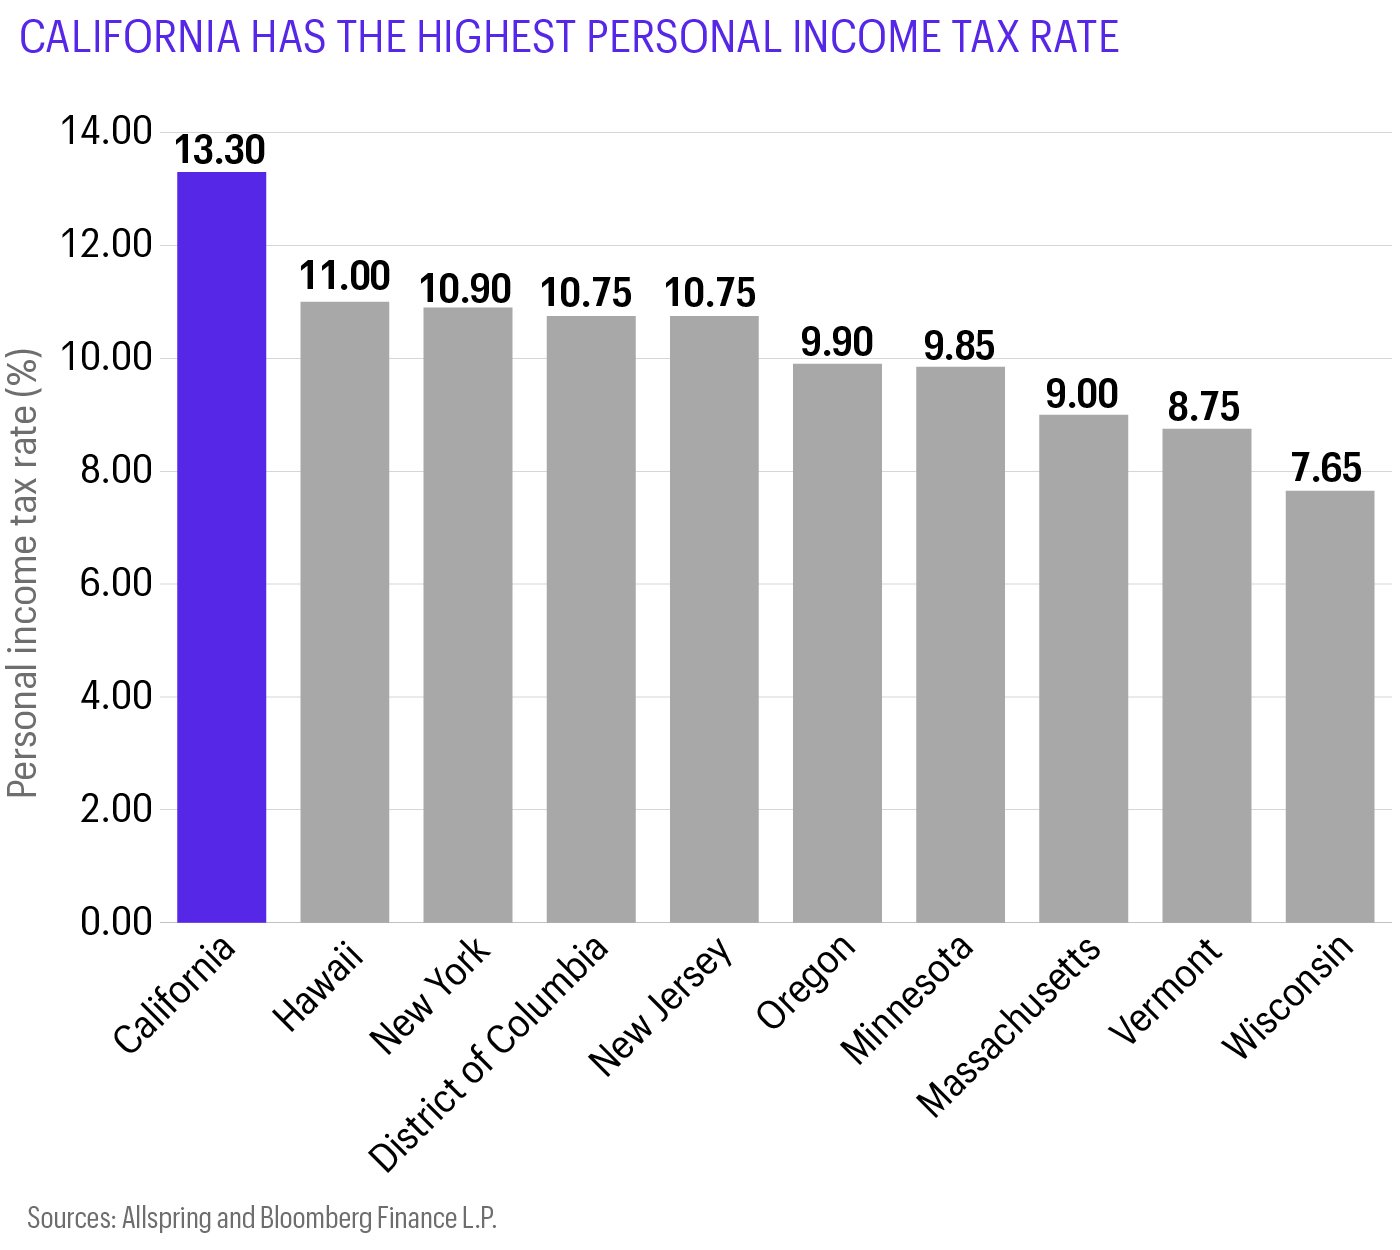
Which state’s residents could potentially benefit the most in terms of tax-free income?
California’s! California has nine income tax rates ranging from 1.0% to 13.3%. (While the state’s top income tax rate is 12.3%, residents with taxable income exceeding $1,000,000 are subject to an additional 1.0% mental health services tax.)
Which state has the highest average credit rating for its publicly rated local governments (cities, counties, school districts, and special districts)?
California! The average credit rating for California’s local governments is the highest in the U.S. In a slowing economy, these local governments may “weather the storm” better than most other states’ local governments.
With California’s municipal yields currently near multiyear highs and the high state tax rates Californians are subject to, they may want to consider doing more than “California dreamin’”—by taking advantage of the currently attractive tax-exempt yields and diversification flexibility of California municipal bonds.
The 3.8% net investment income tax is a federal tax that applies to individuals, estates, and trusts with income exceeding certain thresholds: $250K married filing jointly, $125K married filing separately, $200K single or head of household, and $250k qualifying widow(er) with a dependent child.
The taxable-equivalent yield is the pretax yield that must be received on a taxable security in order to provide the holder the same after-tax yield as that earned on a tax-exempt security.
Yield to worst = the worst possible yield for a bond without the issuer of the bond going into default
Allspring Global Investments does not provide accounting, legal, or tax advice or investment recommendations. Any tax or legal information on this page is merely a summary of our understanding and interpretations of some of the current income tax regulations and is not exhaustive. Investors should consult their tax advisor or legal counsel for advice and information concerning their particular situation.
This material is provided for informational purposes only and is intended for retail public distribution in the United States. Use outside the United States is for professional/qualified investors only.
ALL-06092025-ueonlugs
Related insights

George Bory explains why bond markets in 2026 should favor discipline and flexibility. Positive real yields, global policy divergence, and credit dispersion may create opportunities for income generation and selective positioning.

Janet Rilling and Hannah Rosencrantz give a Q3 fixed income market update—discussing strong bond performance, potential risks in credit compensation, and strategies for building resilient portfolios in Q4.

Fixed income benchmark construction has two fundamental flaws. First, exposures prioritize the needs of borrowers rather than investors. Second, this tends to expose investors to the biggest risks at the worst times.

Two of Allspring’s senior portfolio managers and high yield specialists, Chris Lee and Mike Schueller, sit down with Daniel Sarnowski to discuss recent volatility and why focusing on shorter-duration, higher-quality high yield assets could be the answer in uncertain markets.
Nick Venditti, Allspring’s head of Municipal Fixed Income, explains the impact of the recently passed One, Big, Beautiful Bill on our SpringTalk Muni Moments. And the good news for muni investors? It’s not bad news.
After a mid-April “tariff tantrum,” bond markets appear to be moving past trade headlines and turning their attention to upcoming tax policy and budget negotiations.

George Bory, chief investment strategist for Allspring Fixed Income, explains how active investing in fixed income can offer key advantages over passive investing by prioritizing investor needs, accounting for opportunity costs, and exploiting structural inefficiencies within the bond market.
Nick Venditti, head of Municipal Fixed Income, delves into the recent volatility in the fixed income markets in this episode of Allspring Muni Moments. With elevated yields and favorable muni-to-Treasury ratios, Nick highlights why now might be the time to explore municipal fixed income investments.

The market volatility following “Liberation Day” drove municipal yields to levels not seen since the Global Financial Crisis, presenting real opportunities for investors.
Bond markets are adjusting to tariff impacts amid economic uncertainty. Fixed income investments can help protect against downturns. Expect further yield curve steepening and sector rotation. Use “Riding the Curve” solutions to help maximize income and diversify duration.
Nick Venditti, head of Municipal Fixed Income at Allspring Global Investments, talks about how, for the first time in a while, the higher education sector is starting to show signs of distress.

Allspring's Plus Fixed Income team explains the three key elements they believe may lead to a more balanced and enhanced return profile.